Quarterly Portfolio Manager Commentary
June 30, 2023

Cash Management Portfolios
What market conditions had a direct impact on the bond market this quarter?
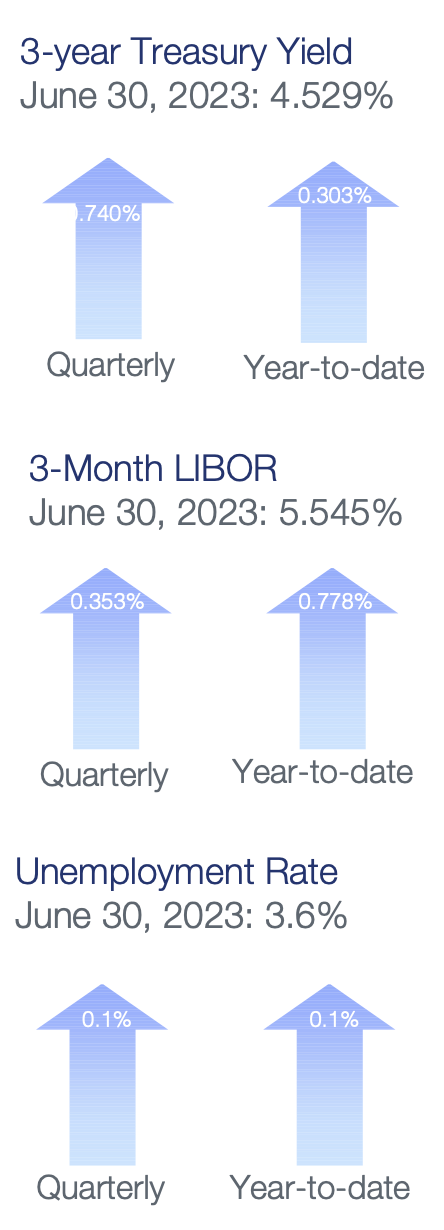
Economic Activity – U.S. economic activity moderated during the second quarter (Q2), but the economy continues to show surprising strength and resiliency in the face of aggressive Federal Reserve (Fed) monetary policy tightening. U.S. Gross Domestic Product (GDP) growth is projected near 1.8% for Q2, led by robust employment gains and solid consumer spending and comparable to the first quarter’s 2.0% tempo. Consumption grew at a modest pace in Q2 as U.S. consumers continue to benefit from a tight labor market and solid balance sheets, supporting resilience to persistent inflation and tightening financial conditions. Despite signs of gradual easing, employment conditions remain quite firm with May U.S. job openings standing at 9.8 million open positions versus total unemployed workers in the labor force of 5.9 million. Monthly Non-farm Payrolls (NFP) growth has cooled but remains strong, averaging 244,000 during Q2, and the U3 Unemployment Rate was 3.6% in June. Growth in Average Hourly Earnings remains elevated at 4.4% year-over-year (YoY), further emphasizing strong labor demand. Inflation pressures eased throughout the quarter with the headline Consumer Price Index (CPI) declining meaningfully to 3.0% in June (5.0% in March) and CPI ex. food and energy rising 4.8% YoY for June compared to 5.6% YoY in March. The Fed’s preferred inflation index – the PCE Core Deflator Index – increased 4.6% YoY for May. Falling energy prices have driven the sharp decline in headline inflation during the first half of 2023 but core inflation has proven stickier than expected due to persistent core services price pressures. While the recent decline in core inflation is encouraging, it remains too high and economic activity hasn’t slowed enough to give the Fed confidence inflation is on a sustained downward trend.
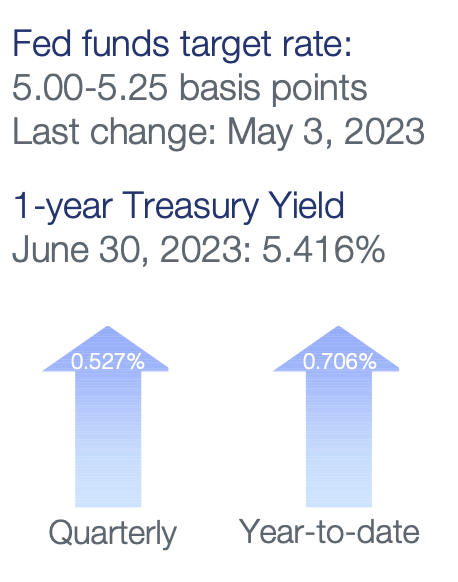
Monetary Policy – The Fed further tightened monetary policy during the quarter, raising the federal funds rate by 25 basis points (bps) at the May 3 meeting to a target range of 5.0% to 5.25%. The Fed elected to keep rates unchanged at its June 14 meeting, however, as they continue to moderate the pace of tightening and access lagged impacts of prior rate increases. Additionally, the Fed continued to implement its balance sheet reduction program (quantitative tightening), with a monthly cap of $60 billion in Treasury securities and $35 billion of agency mortgage-backed securities.
Following the June meeting, the Federal Open Market Committee (FOMC) released its updated Summary of Economic Projections which suggest the Fed is retaining a tightening bias despite the June pause. The median projection for the federal funds rate at the end of 2023 was increased to a range of 5.5% to 5.75%, signaling expectations for two additional rate hikes this year. Revisions to economic projections also reflect stronger-than-expected growth this year as the FOMC lowered its year-end 2023 median forecast for unemployment to 4.1% from 4.5% and upgraded its forecast for annual GDP growth to 1.0% from 0.4%. In a sign that tighter monetary policy is having a limited impact on demand thus far, the Fed also boosted its year-end median forecast for core PCE inflation to 3.9% from 3.6%. The Fed continues to anticipate maintaining restrictive rate policies into 2024 to ease labor market conditions and bring inflation down toward its 2% target.
Fiscal Policy – Government spending was a drag on U.S. GDP in 2022, but this is set to change in 2023 following the late December passage of a $1.7 trillion spending bill for fiscal year 2023. The bill includes a 6% increase in spending for domestic initiatives and a 10% increase in defense programs. A split government and the near-term need to extend the debt ceiling and pass a federal budget makes the likelihood of another significant fiscal package unlikely over the next two years. On the municipal side, state and local governments have seen early signs of tax collections starting to slow, but strong reserves have left them in a solid position if economic conditions weaken further.
Credit Markets – Credit markets improved in the quarter, with corporate and ABS spreads tightening on stronger investor demand for risk and yield following the financial market stress sparked by bank failures in March. Yield curve levels rose as the potential for additional Fed rate hikes became more widely accepted in the market. The corporate and ABS new issue markets were reasonably active in the quarter and continue to offer concessions to secondary market opportunities. Secondary market liquidity was solid in the quarter.
Yield Curve Shift
|
U.S. Treasury Curve |
Yield Curve 3/31/2023 |
Yield Curve 6/30/2023 |
Change (bps) |
|---|---|---|---|
|
3 Month |
4.693% |
5.284% |
59.1 |
|
1 Year |
4.591% |
5.392% |
80.1 |
|
2 Year |
4.025% |
4.895% |
87.0 |
|
3 Year |
3.788% |
4.527% |
73.9 |
|
5 Year |
3.573% |
4.156% |
58.3 |
|
10 Year |
3.468% |
3.837% |
36.9 |
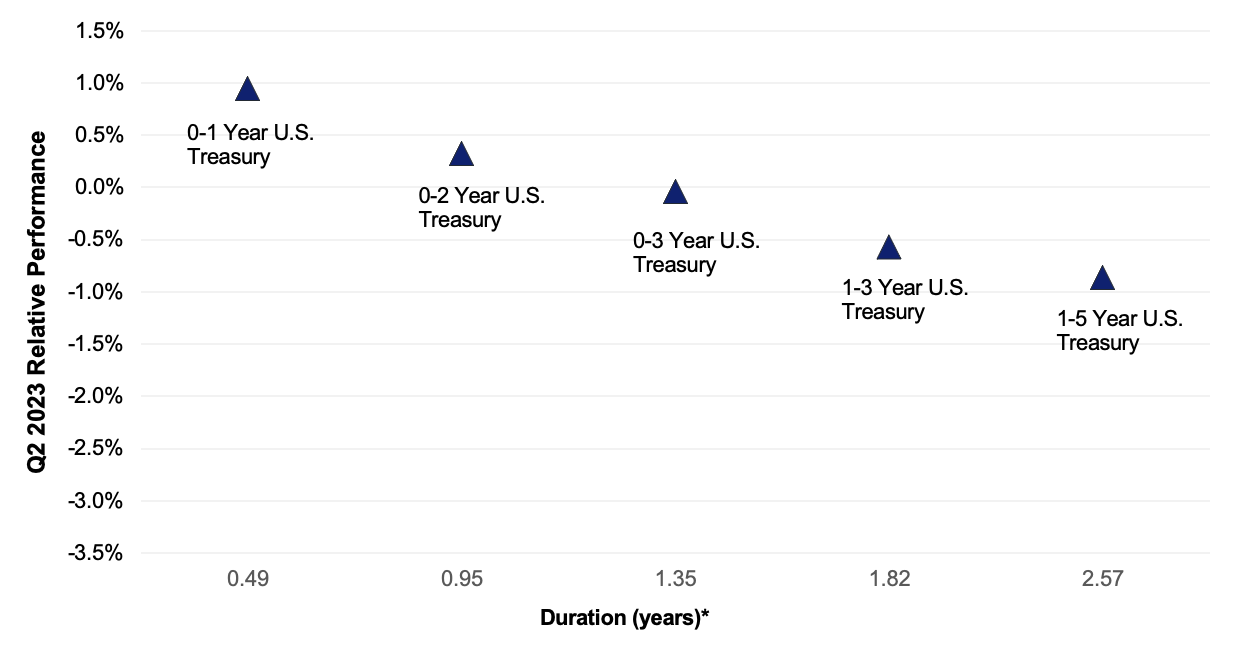
Duration Relative Performance

*Duration estimate is as of 6/30/2023
The jump in yield curve levels pushed absolute returns for longer-duration treasury indexes into negative territory. The three-month to five-year portion remained inverted by approximately 112 bps, highlighting the positive carry of investing in short-term treasuries versus locking in current levels out the yield curve.
Credit Spread Changes
|
ICE BofA Index |
OAS* (bps) 3/31/2023 |
OAS* (bps) 6/30/2023 |
Change (bps) |
|---|---|---|---|
|
1-3 Year U.S. Agency Index |
12 |
18 |
6 |
|
1-3 Year AAA U.S. Corporate and Yankees |
9 |
12 |
3 |
|
1-3 Year AA U.S. Corporate and Yankees |
40 |
35 |
-5 |
|
1-3 Year A U.S. Corporate and Yankees |
91 |
74 |
-17 |
|
1-3 Year BBB U.S. Corporate and Yankees |
135 |
105 |
-20 |
|
0-3 Year AAA U.S. Fixed-Rate ABS |
92 |
74 |
-18 |
Option-Adjusted Spread (OAS) measures the spread of a fixed-income instrument against the risk-free rate of return. U.S. Treasury securities generally represent the risk-free rate.
A-rated and BBB-rated corporate credit spreads tightened in the quarter, leading to general outperformance versus higher-quality counterparts. AAA-rated ABS also performed well in the quarter and continue to offer yields in line with single-A corporate debt.
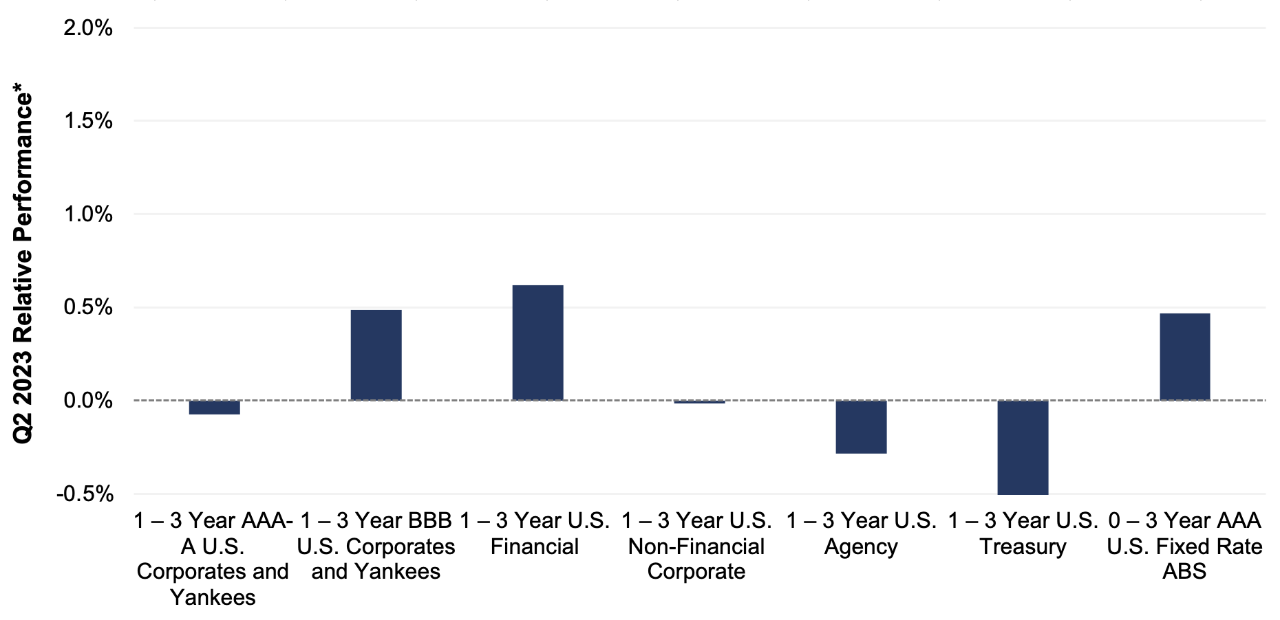
Credit Sector Relative Performance of ICE BofA Indexes

ICE BofA Index
*AAA-A Corporate index outperformed the Treasury index by 49.7 bps.
*AAA-A Corporate index underperformed the BBB Corporate index by 56.0 bps
*U.S. Financials outperformed U.S. Non-Financials by 63.5 bps
Credit outperformed comparable duration treasuries in the quarter on incremental coupon income and tighter credit spreads. BBB rated credit outperformed higher quality debt, reflecting the increased risk appetite of investors as markets recovered from March’s financial system stress. Not surprisingly, U.S. financials meaningfully outperformed non-financial corporate debt.
What strategic moves were made and why?
Taxable Portfolios – Short duration, investment-grade index returns were mostly negative in the quarter, as the sharp rise in yield curve levels offset coupon income and credit spread tightening in the A- and BBB-rated sectors. Money market and ultra-short duration portfolios benefitted from an additional Fed rate hike, with a rise in book yields as short-term rates and repo moved over 5.0%. The financial system stress seen in March abated as bank funding pressures eased, allowing corporate credit spreads to partially recover some of the widening from Q1. Portfolios with an overweight to credit and a short-to-benchmark duration target strategy provided excess returns and outperformed the benchmark. Fundamental credit quality remains solid in the investment-grade universe, although financials and regional U.S. banks will need to deliver additional quarters of improvement to bolster investor confidence.
Tax Exempt and Tax-Efficient Portfolios – Municipal bond new issuance picked up in Q2 but remains behind last year’s pace. Tax-exempt supply year-to-date (YTD) through June is approximately 11% lower – a shortage of nearly $20 billion versus 2022. A surge in reinvestment demand has exacerbated the situation for investors, with some strategists pointing to more than $130 billion in municipal maturities between May and August. This outlook for strong technical market conditions encouraged us to proactively bring durations for municipal-only mandates closer to benchmark levels. There was a window of opportunity to extend portfolios in April/May with several big competitive sales on the new issue calendar. We took advantage of this period to add high-quality issues with maturities in the three- to four-year area. Taxable municipals continued to offer higher income than traditional tax-exempts on a tax-adjusted basis. However, we were dissuaded from purchasing these securities in April and May due to the persistently lower Treasury yields.
As rates increased late in the quarter, we became increasingly motivated and were buyers. We found the best value in four-year taxable municipals due to similar absolute yields (versus three-year alternatives) and a longer runway to benefit from eventual Fed interest rate cuts.
How are you planning on positioning portfolios going forward?
Taxable Portfolios – The Fed is expected to raise rates 25 bps at the July 26 meeting, with a strong focus on data dependency to determine if an additional rate hike is required at the September or November meetings. Whether the Fed raises rates an additional 25 or 50 bps is less important than how long rates are kept at an elevated level. We have not been predicting Fed rate cuts in 2023 and rates markets have begun to price in a similar conclusion. Despite improvements in recent inflation data, we believe core inflation will remain stubbornly high as the economy appears to be less interest rate sensitive than in past years. This will require the Fed to follow through with “higher for longer” policies before inflation begins to durably trend toward 2%. With the Fed near the end of the rate hike cycle and becoming even more data dependent, we expect yield curve levels to remain volatile and will look for opportunities on rate spikes to bring portfolios closer to portfolio benchmark duration. Given the inversion of the yield curve, we will also focus on overweighting front-end positions to capture higher yields. Tactics to accomplish our front-end strategy include short-term commercial paper and Secured Overnight Financing Rate-based floating-rate debt, which are currently providing yields well above 5.0%. Yields on callable agency debt have benefitted from recent yield curve volatility and offer rates comparable to single-A industrial corporates while assuming call risk in lieu of credit risk. Slowing growth, declining corporate profitability, and recent financial system stress all argue for enhanced scrutiny on issuers and security selection, such as focusing on bank-level debt rather than holding company debt. Prime auto, credit card and equipment loan ABS remain a favored sector on continued consumer resilience and strong underlying credit metrics.
Tax Exempt and Tax-Efficient Portfolios – We are determined to keep portfolio durations near benchmark levels. Given the supply/demand imbalances, July is not typically the best month to put money to work in the tax-exempt space. However, relative ratios of three-year municipals versus Treasuries look somewhat reasonable. Variable rate demand note/cash sweep are likely to offer the best income for the remainder of they year, but we are also mindful of longer time horizons in which fixed-rate holdings may benefit. It is a noteworthy observation how much flatter the municipal yield curve is relative to the Treasury curve. For example, investors give up approximately 100 basis points (bps) in yield in choosing a three-year Treasury versus a one-year; for tax-exempt municipals the give up is only 25 bps. Yield curve positioning will likely continue to favor purchases of maturities three years and longer to give us more of a window to benefit from eventual Fed easing.
Sources
Bloomberg C1A0, CY11, CY21, CY31, G1P0, ICE Bond, JOLTTOTL, NFP TCH, PCE CYOY, US0003M, USUETOT and USURTOT Indices
Bloomberg, U.S. December Employment Situation: Statistical Summary, Bloomberg, U.S. Economic Forecast
Bloomberg, U.S. Treasury Actives Curve
Federal Reserve Press Release, June 14, 2023
Federal Reserve, Summary of Economic Projections, June 14, 2023
Wall Street Journal, "What's in the Debt-Ceiling Deal", David Harrison and Kristina Peterson, May 31, 2023


