Quarterly Portfolio Manager Commentary
September 30, 2023

Cash Management Portfolios
What market conditions had a direct impact on the bond market this quarter?
Economic Activity – U.S. economic activity continues to defy expectations for a sharp slowdown as it displays surprising resiliency in the face of aggressive Federal Reserve (Fed) monetary policy tightening. U.S. Gross Domestic Product (GDP) growth is projected near 3.0% for Q3, led by strong consumer spending and business fixed investment comparable to the second quarter’s 2.1% pace. Personal consumption accelerated in Q3 as U.S. households continue to benefit from moderating price pressures and solid job and income gains, supporting resilience to tighter financial conditions and lending standards. Recent employment trends have shown gradual moderation, but conditions remain quite firm with August U.S. job openings standing at 9.6 million open positions versus total unemployed workers in the labor force of 6.4 million. Monthly Non-farm Payrolls (NFP) growth continues to be strong, averaging 266,000 during Q3, and the U3 Unemployment Rate was 3.8% in September. Growth in Average Hourly Earnings is off its highs but still elevated at 4.2% year-over-year (YoY), further emphasizing strong labor demand. Headline inflation readings increased throughout the quarter, reflecting rising energy prices with the Consumer Price Index (CPI) at 3.7% in August (3.0% in June). Core inflation, however, continued its gradual downward trend with CPI ex. food and energy rising 4.3% YoY for August compared to 4.8% YoY in June. The Fed’s preferred inflation index – the PCE Core Deflator Index – increased 3.9% YoY for August. While the continual decline in core inflation is encouraging, the economy remains a long way from the Fed’s target of sustained 2% inflation.
Monetary Policy – The Fed further tightened monetary policy during the quarter, raising the federal funds rate by 25 basis points (bps) at the July 26 meeting to a target range of 5.25% to 5.50%. The Fed elected to keep rates unchanged at its September 20 meeting as they continue to monitor incoming economic data and access lagged impacts of prior rate increases. The September rate pause was viewed as hawkish, with the Fed emphasizing stronger growth could prompt further rate hikes. Additionally, the Fed continued to implement its balance sheet reduction program (quantitative tightening), with a monthly cap of $60 billion in Treasury securities and $35 billion of agency mortgage-backed securities.
Following the September meeting, the Federal Open Market Committee (FOMC) released its updated Summary of Economic Projections. The median projection for the federal funds rate at the end of 2023 was unchanged, but the projection for year-end 2024 was revised to a range of 5.0% to 5.25% compared to 4.5% to 4.75% following the June FOMC meeting, signaling the Fed’s desire to retain higher-for-longer policy rates. The updated economic projections suggest a growing consensus among the FOMC for an economic soft-landing as annual GDP growth forecasts were revised higher, projections for unemployment lowered and core PCE inflation was left largely unchanged. The revised projections appear to reflect a best-case scenario, suggesting inflation can decline toward the Fed’s 2% target without a meaningful slowdown in growth or deterioration in unemployment.
Fiscal Policy – Government spending is projected to add to U.S. GDP in 2023 as the current fiscal-year spending bill includes increases in domestic initiatives and defense programs. Recent legislative actions suggest government spending will have a modest dampening effect on economic growth starting in 2024. The debt ceiling agreement in June keeps non-defense discretionary spending flat in 2024 while capping growth at 1% in 2025. With defense spending set to increase about 3% in 2024, these levels imply a reduction in real spending over the next two years. Further, Congress narrowly averted a government shutdown at the end of September by passing a 45-day continuing resolution. The resolution maintains current spending levels as Congress negotiates a new annual budget, but Congressional Republicans have voiced demands for spending cuts next year to avoid a government shutdown. Looking beyond the immediate concerns, the Infrastructure and Jobs Act (2021) and Inflation Reduction Act (2022) will boost government spending over the long-term, but near-term impacts are likely to be minor. State and local government finances are starting to diverge, with municipal entities more dependent on sales and property taxes faring better than those relying on income taxes, but strong reserves have left the overall sector in a solid position should economic conditions weaken further.
Credit Markets – With markets converging toward the Fed’s higher-for-longer guidance, yield curve levels rose meaningfully, particularly on the longer-end of the yield curve. Despite the jump in rates and elevated market volatility, credit spreads ended the quarter relatively in line with the close of Q2. As a result, credit outperformed Treasuries on incremental coupon income. Higher market yields drove absolute portfolio returns and provided a cushion against negative price action from higher rates. Corporate and ABS new issue markets were reasonably active in the quarter and continue to offer concessions to secondary market opportunities. Secondary market liquidity remained solid in the quarter.
Yield Curve Shift
|
U.S. Treasury Curve |
Yield Curve 6/30/2023 |
Yield Curve 9/30/2023 |
Change (bps) |
|---|---|---|---|
|
3 Month |
5.284% |
5.446% |
16.2 |
|
1 Year |
5.392% |
5.448% |
5.6 |
|
2 Year |
4.895% |
5.044% |
14.9 |
|
3 Year |
4.527% |
4.799% |
27.2 |
|
5 Year |
4.156% |
4.609% |
45.3 |
|
10 Year |
3.837% |
4.571% |
73.4 |
Duration Relative Performance
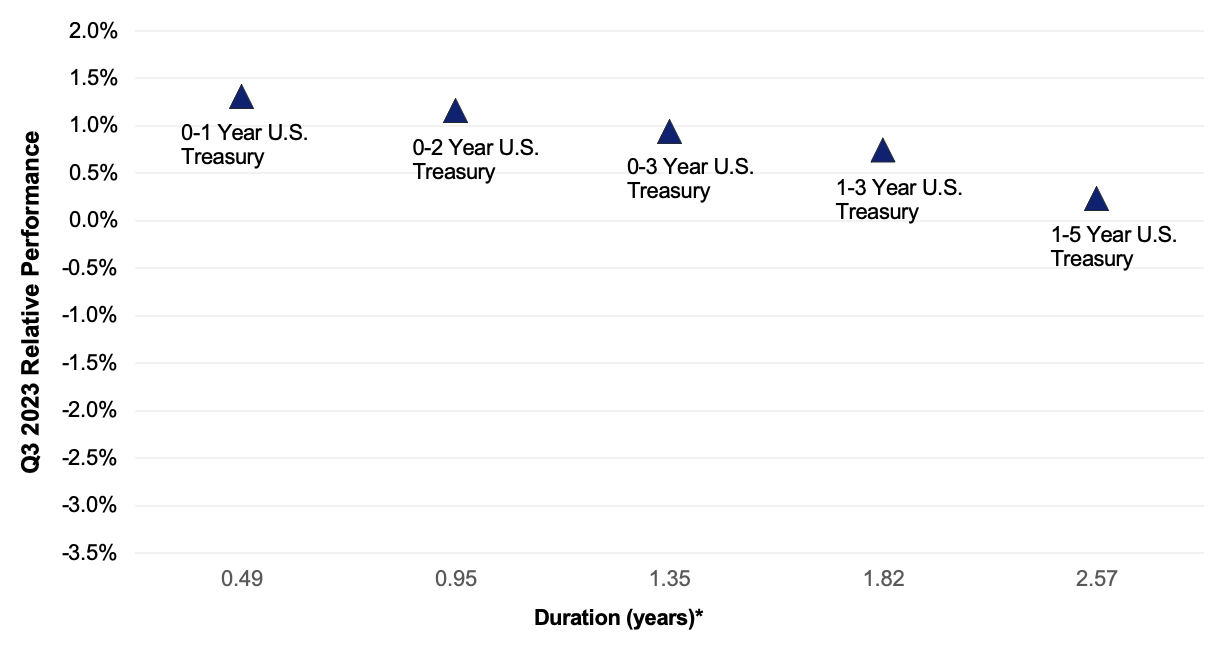
*Duration estimate is as of 9/30/2023
Despite the jump in yield curve levels, absolute returns for short and longer-duration Treasury indexes were positive. The three-month to five-year portion steepened by 29.2 bps as longer-end yields rose more than short-term yields. As expected, shorter duration Treasury strategies outperformed longer strategies.
Credit Spread Changes
|
ICE BofA Index |
OAS* (bps) 6/30/2023 |
OAS* (bps) 9/30/2023 |
Change (bps) |
|---|---|---|---|
|
1-3 Year U.S. Agency Index |
18 |
21 |
3 |
|
1-3 Year AAA U.S. Corporate and Yankees |
12 |
16 |
4 |
|
1-3 Year AA U.S. Corporate and Yankees |
35 |
40 |
5 |
|
1-3 Year A U.S. Corporate and Yankees |
74 |
80 |
6 |
|
1-3 Year BBB U.S. Corporate and Yankees |
105 |
109 |
4 |
|
0-3 Year AAA U.S. Fixed-Rate ABS |
74 |
70 |
-4 |
Option-Adjusted Spread (OAS) measures the spread of a fixed-income instrument against the risk-free rate of return. U.S. Treasury securities generally represent the risk-free rate.
Despite meaningfully higher yield curve levels and overall market volatility, overall credit spreads ended the quarter in a tight band of 4-6 bps to end of Q2 levels. As a result, coupon income was the key driver of performance differentials among asset classes. AAA-rated ABS also performed well in the quarter and continue to offer yields in line with single-A corporate debt.
Credit Sector Relative Performance of ICE BofA Indexes

ICE BofA Index
*AAA-A Corporate index outperformed the Treasury index by 2.6 bps.
*AAA-A Corporate index underperformed the BBB Corporate index by 25.5 bps
*U.S. Financials outperformed U.S. Non-Financials by 23.3 bps
Credit, agencies and ABS outperformed comparable duration Treasuries in the quarter, primarily on incremental coupon income as overall spreads remained reasonably stable. U.S. financials meaningfully outperformed non-financial corporate debt as concerns over bank funding continue to ebb since March.
What strategic moves were made and why?
Taxable Portfolios – Despite the rise in yield curve levels, short duration investment-grade index returns were positive in the quarter. Significant portfolio yields drove portfolio returns and provided a cushion against negative price action from higher rates. Financial exposure continued to benefit portfolios, as bank spreads continue to improve from March wides. Short-to-benchmark strategies benefitted portfolios, especially those portfolios with target duration over one-year. Toward the latter half of the quarter as market yield better reflected the risk of higher-for-longer Fed policies, portfolio durations were extended to lock in attractive current yields. Portfolio book yields continued to climb as portfolio cash flows were reinvested in higher yielding debt. Rating activity in the quarter skewed negative, highlighted by Fitch cutting the United States’s AAA rating to AA+ on August 1.
Tax Exempt and Tax-Efficient Portfolios – Reinvestment was directed toward variable rate demand notes (VRDNs) or allowed to remain in cash sweep vehicles for much of the quarter. We built these cash-like positions due to an inverted yield curve and strong technical market conditions. Cash equivalents fared better than 3-year fixed rate alternatives by close to 40 bps on average. With low conviction toward a dramatic change in the tone for Fed policy, we were reluctant to give up that much current income. Municipal bond prices were heavily pressured in September. Several factors led to the sell-off, including rising Treasury yields, investor outflows from municipal funds, expectations for a surge in tax-exempt new issuance, and seasonal declines in the level of outstanding municipal bond maturity and coupon payments. Short maturity, fixed-rate yields increased approximately 50 bps during this time. We were motivated to re-engage at these better levels and made several purchases to extend portfolio durations closer to benchmarks.
How are you planning on positioning portfolios going forward?
Taxable Portfolios – We anticipate the Fed will hold rate policy rates steady at the November 1 meeting, with the December 13 decision being highly data dependent. Regardless of the Fed’s decision, markets have begun pricing in higher-for-longer Fed rate policies and current market yields offer more compelling value for portfolios, particularly out to 18 months. We believe at these yield curve levels, policy and rate risk is skewed to the downside as a potential recession and increased market uncertainty are more likely to push rates down versus higher over the coming quarters. We anticipate moving portfolios closer to benchmark duration and will look to continue locking in rates to hedge against a Fed pivot. Yield curve volatility continues to offer tactical opportunities in callable agency debt, providing yields comparable to single-A industrial corporates while assuming call risk in lieu of credit risk. An uncertain economic outlook, declining corporate profitability, rising rating risk, and tightening financial conditions demand enhanced scrutiny on issuers and security selection. We anticipate consumer credit metrics will continue to deteriorate, particularly for sub-prime borrowers, but we will continue to focus on prime auto, credit card and equipment loan AAA-rated ABS on strong structural credit enhancements and continued solid collateral performance.
Tax Exempt and Tax-Efficient Portfolios – We believe conditions will likely remain attractive for further extension trades over the coming weeks. Municipal strategists are expecting net positive municipal supply in October, which is a welcome occurrence for those investors looking to put new money to work. We plan to take advantage of this opportunity to move portfolio durations closer to benchmarks. For accounts able to consider taxable municipals, we see value in securities with 1- to 2-year maturities. We will be looking to allocate some cash in this area. Taxable municipals continue to offer higher income than traditional tax-exempts on a tax-adjusted basis. Further, current yields on these investments are competitive versus money market sweep options, and also provide insurance against potential Fed interest rate cuts.
Sources
Bloomberg C1A0, CY11, CY21, CY31, G1P0, ICE Bond, JOLTTOTL, NFP TCH, PCE CYOY, US0003M, USUETOT and USURTOT Indices
Bloomberg, U.S. December Employment Situation: Statistical Summary, Bloomberg, U.S. Economic Forecast
Bloomberg, U.S. Treasury Actives Curve
Federal Reserve Press Release, September 20, 2023
Federal Reserve, Summary of Economic Projections, September 20, 2023
Wall Street Journal, "What's in the Debt-Ceiling Deal", David Harrison and Kristina Peterson, May 31, 2023


