Quarterly Portfolio Manager Commentary
September 30, 2024

Cash Management Portfolios
What market conditions had a direct impact on the bond market this quarter?
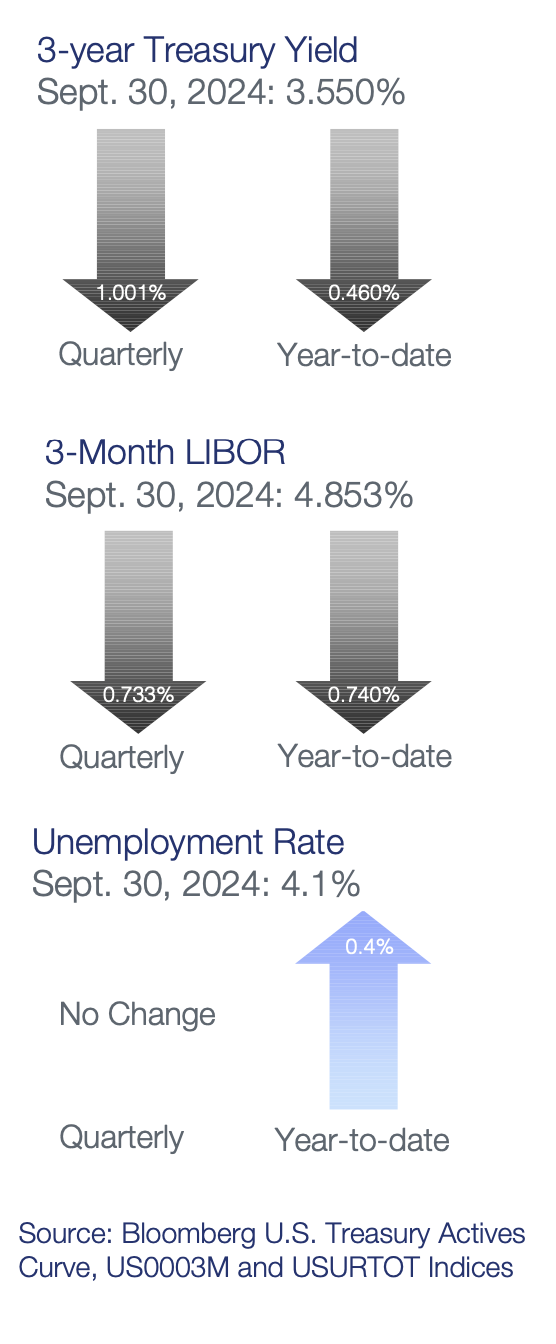
Economic Activity – The U.S. economy continues to perform well this year, exceeding expectations and defying traditional signals of recession. Following above-trend growth of 3.0% in the second quarter, U.S. Gross Domestic Product (GDP) is projected to grow near 2.0% for the third quarter (Q3) amid still-firm domestic demand and business investment. Personal consumption was steady throughout Q3 as income growth helped offset persistent headwinds from elevated prices and high interest rates. Labor market conditions cooled early in the quarter but rebounded in September, ending Q3 largely where it began, with August U.S. job openings stable at 8.0 million open positions while total unemployed workers in the labor force as of September were unchanged at 6.8 million. Monthly Non-farm Payrolls growth accelerated, averaging 186,000 during Q3 and the U3 Unemployment Rate was 4.1% in September, matching the level from June. Average Hourly Earnings growth is off its highs but remains elevated at 4.0% year-over-year (YoY), emphasizing still-solid labor demand. The Consumer Price Index (CPI) declined to 2.5% in August versus 3.0% in June as energy prices fell throughout the quarter. Core inflation continued its gradual downward trend with CPI ex. food and energy rising 3.2% YoY for August compared to 3.3% YoY in June. The Federal Reserve’s (Fed) preferred inflation index – the PCE Core Deflator Index – increased 2.7% YoY for August. While recent data has been encouraging, the inflation fight is not over as progress remains mixed, driven by core goods deflation. Further disinflation in core services and housing will be necessary to ultimately achieve the Fed’s 2% target and desired soft landing.
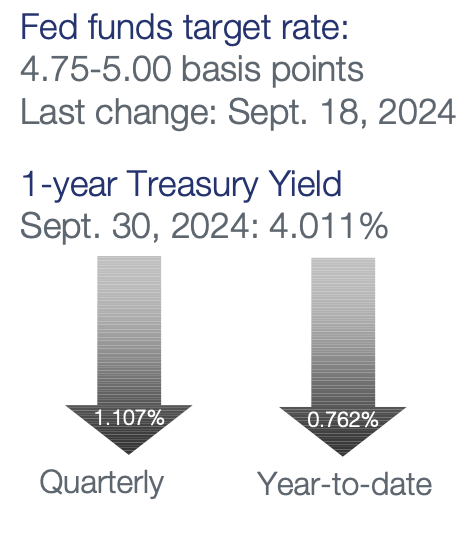
Monetary Policy – The Fed cut its federal funds target range by 50 basis points (bps) to 4.75% to 5.0% at the September 18 meeting. While a rate cut in September was fully expected by the market, expectations were split between 25 and 50 bps. The Fed’s post-meeting statement was updated to say the Committee has “gained greater confidence” inflation is moving toward its 2% target and risks to inflation and employment are judged as “roughly in balance.” The Fed continues to implement its balance sheet reduction program (quantitative tightening), with a monthly cap of $25 billion in Treasury securities and $35 billion of agency mortgage-backed securities. During the press conference Chair Powell stated at this point they are not thinking about stopping quantitative tightening as they cut rates, noting the two can happen in tandem and are both forms of normalization.
The Federal Open Market Committee (FOMC) released its updated Summary of Economic Projections at the September meeting, indicating additional rate cuts are coming. The median projection for the federal funds rate at the end of 2024 was revised to a range of 4.25% to 4.50%, signaling 50 bps of rate cuts for the remainder of this year. The median dots also show rate cuts of 100 bps in 2025 and 50 bps in 2026, leading to a terminal neutral rate of 2.875%. The FOMC’s economic projections were revised to show forecasts for a higher unemployment rate at the end of the year compared to the prior release (4.4% vs. 4.0%) and slightly lower core inflation and GDP growth. The unemployment rate forecast was also increased by 0.2% compared to the prior release for both 2025 and 2026 while revisions to inflation and GDP were minimal. While the median funds rate projections are helpful to understand Fed officials’ current expectations, the near-term pace of easing will ultimately be dictated by the labor market given the Fed’s desire to limit further weakening.
Fiscal Policy – The federal government once again narrowly avoided a shutdown at the end of September with Congress passing a continuing resolution to fund government operations at existing spending levels through December 20. Fiscal policy action will be muted over the near-term as Washington D.C.’s focus fully shifts to the upcoming elections, but should pick up later this year as Congress will need to come to an agreement on a funding bill for the full fiscal year and the U.S. government debt ceiling will be reinstated January 1, 2025.
Looking further out, government spending is anticipated to increase, with both political parties campaigning on increased fiscal policy initiatives and tax incentives. Recently passed bills for the Infrastructure and Jobs Act (2021) and Inflation Reduction Act (2022) will also boost government spending over the long-term. On the municipal side, state and local governments that are more heavily reliant on sales and property taxes are faring better than municipalities dependent on income taxes, but strong reserves have left the overall sector in a solid position should economic conditions weaken further.
Credit Markets – U.S. Treasury yield curve levels plunged as markets digested the Fed’s 50 bps rate cut. The yield curve steepened in the quarter, with the two- to 10-year portion of the yield curve disinverting for the first time since July 2022. Credit spreads were modestly tighter in the quarter as investor demand for yield and spread product kept pace with heavy new issue corporate supply. As a result, third quarter fixed income total returns were strong across all sectors and duration bands.
Yield Curve Shift
|
U.S. Treasury Curve |
Yield Curve 6/30/2024 |
Yield Curve 9/30/2024 |
Change (bps) |
|---|---|---|---|
|
3 Month |
5.355% |
4.617% |
-73.8 |
|
1 Year |
5.110% |
4.002% |
-110.8 |
|
2 Year |
4.753% |
3.641% |
-111.2 |
|
3 Year |
4.550% |
3.549% |
-100.1 |
|
5 Year |
4.377% |
3.558% |
-81.8 |
|
10 Year |
4.396% |
3.781% |
-61.5 |
Duration Relative Performance
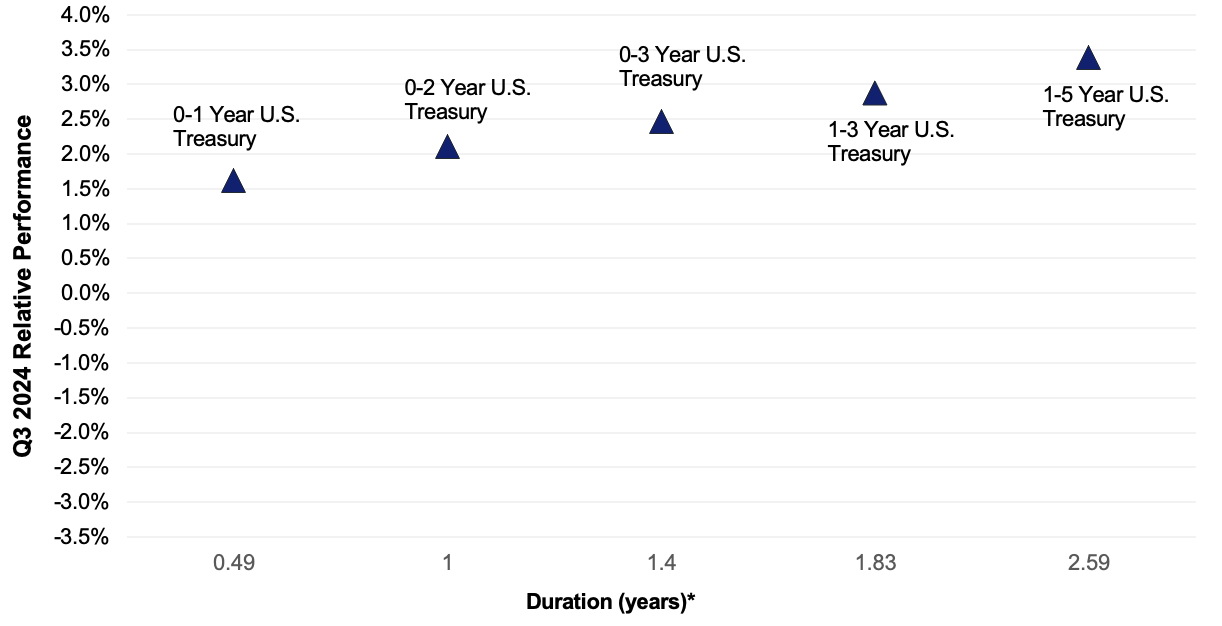
*Duration estimate is as of 9/30/2024
With the path for Fed rate cuts uncertain, yield curve volatility was, and is. expected to remain elevated, placing a premium on identifying tactical extension opportunities. The decline in rates benefitted longer duration strategies over shorter portfolios.
Credit Spread Changes
|
ICE BofA Index |
OAS* (bps) 6/30/2024 |
OAS* (bps) 9/30/2024 |
Change (bps) |
|---|---|---|---|
|
1-3 Year U.S. Agency Index |
5 |
3 |
-2 |
|
1-3 Year AAA U.S. Corporate and Yankees |
10 |
7 |
-3 |
|
1-3 Year AA U.S. Corporate and Yankees |
31 |
26 |
-5 |
|
1-3 Year A U.S. Corporate and Yankees |
56 |
50 |
-6 |
|
1-3 Year BBB U.S. Corporate and Yankees |
82 |
80 |
-2 |
|
0-3 Year AAA U.S. Fixed-Rate ABS |
55 |
58 |
3 |
Option-Adjusted Spread (OAS) measures the spread of a fixed-income instrument against the risk-free rate of return. U.S. Treasury securities generally represent the risk-free rate.
Corporate credit spreads entered the quarter relatively tight from an historical basis, but still managed to further tighten on the margin. Accordingly, corporates debt outperformed comparable duration treasuries. Bucking the trend, triple-A asset-backed securities (ABS) spreads widened in the quarter, leading to underperformance in the quarter versus corporate debt. With valuations slightly more attractive than investment-grade credit, the ABS sector will be a focus for increased allocations coming into the fourth quarter.
Credit Sector Relative Performance of ICE BofA Indexes

ICE BofA Index
ICE BofA Index
*AAA-A Corporate index outperformed the Treasury index by 23.1bps.
*AAA-A Corporate index underperformed the BBB Corporate index by 1.5 bps
*U.S. Financials outperformed U.S. Non-Financials by 14.4 bps
U.S. financials outperformed non-financial corporate debt due to a higher coupon advantage and greater spread tightening for financials versus industrials. BBB credit performance was essentially in line with AAA-A, suggesting better spread compression for higher-quality debt in the quarter.
What strategic moves were made and why?
Taxable Portfolios – The sharp move lower in U.S. Treasury yields and mildly tighter credit spreads drove strong fixed income returns across all sectors and duration strategies in the quarter, with longer duration strategies benefitting more than shorter duration strategies. Portfolios were targeted to be duration neutral to benchmarks within portfolio constraints. Despite historically expensive valuations, corporate credit remained a focus of portfolio construction with an emphasis placed on a heavy third quarter new issue calendar to capture incremental spread concessions and exposure to additional issuers. There were no significant credit or rating events in the quarter, and no single issuer or position had a meaningfully positive or negative impact on portfolio performance.
Tax Exempt and Tax-Efficient Portfolios – Momentum behind new sales of state and local government debt remained strong in Q3. The current pace of tax-exempt borrowing ($348 billion) is the highest September YTD volume ever. This record-breaking issuance presented a conundrum for municipal investors, as it has coincided in the past quarter with a dramatic shift in market expectations for aggressive interest rate cuts from the Federal Reserve. We opted to take a balanced approach to these conditions, which left relative durations for municipal mandates a bit shorter than our taxable accounts. Ultimately, supply was not as much of a headwind for the front-end of the municipal yield curve as had been anticipated. Yields for municipal bonds with one- to five-year maturities fell 60 to 80 bps. We did identify some better value in short-term municipal notes late in the quarter. These traded at attractive spreads versus generic bonds with long term ratings. Some accounts also benefitted from variable-rate demand notes (VRDNs) which offered higher current income versus fixed-rate alternatives.
How are you planning on positioning portfolios going forward?
Taxable Portfolios – With yield curve levels closer to our Fed outlook post-September employment report, we will continue to tactically add duration to maintain portfolio durations near 100% of benchmarks. Historically, as markets anticipate Fed rate cuts, the yield curve will steepen as short to intermediate yields fall faster than longer yields, arguing for a bulleted portfolio structure. Our duration positioning is driven by reasonable yield curve valuations, and in our opinion the balance of risks is skewed toward lower rather than higher rates through the end of the year. We base this outlook on 1) the Fed’s reaction function remains asymmetric, as policymakers will tolerate stronger economic or employment data but are prepared to ease should conditions weaken, and 2) the market is biased to take rates down, implying the weight of evidence must convincingly be on the side of sustained or re-acceleration of growth and/or inflation to move yield curve levels noticeably higher. Credit spreads remain tight from a historical level, but we expect to maintain on overweight to credit as the probability of an economic “soft landing” increases and bolsters the outlook for corporate credit quality. The credit spread differential between higher and lower-rated issuers remains tight, and USBAM is focusing on higher-rated, higher-quality issuers on relative value considerations. Agency spreads to comparable duration treasuries is in the low to mid-single digits, leading USBAM to focus on treasuries in the fixed government space while opportunistically adding callable agencies when appropriate. While consumer credit metrics show signs of deterioration, particularly for sub-prime borrowers, we continue to focus on well-structured prime auto, credit card and equipment loan AAA-rated ABS yielding comparable to single-A rated corporates.
Tax Exempt and Tax-Efficient Portfolios – The municipal bond market is expected to face headwinds from supply into October. Issuers are intent on getting new deals placed ahead of the election to avoid potential volatility. While municipal bond prices have been resilient over the past few months, the recent increase in Treasury yields may present a greater challenge. Additionally, near term reinvestment demand from municipal bond maturity and coupon payments is considerably less than the July to August period. One strategist estimates that new tax-exempt bonds issued in October will overwhelm demand – with a net positive supply of more than $20 billion. Specifically, the two to three weeks just before the election may represent the best opportunity for new buyers. We would welcome some cheapening in municipal versus treasury relative ratios as a chance to bring portfolio durations closer to benchmarks.
Sources
Bloomberg
https://www.federalreserve.gov/monetarypolicy/files/monetary20240731a1.pdf
https://www.federalreserve.gov/monetarypolicy/files/monetary20240918a1.pdf
https://www.federalreserve.gov/monetarypolicy/files/fomcprojtabl20240918.pdf
https://www.cbsnews.com/news/house-vote-continuing-resolution-government-shutdown/

Jim Palmer, CFA

Eric Espeseth